Types of maps
By Omar Kawach
Reference maps
Reference maps serve a general purpose. They can be found in the form of transit maps, topographic maps, road maps, hiking trail maps, and so on. Reference maps have no intended theme and only showed the location and names of features.
Thematic maps
Thematic maps, unlike reference maps, serve a special purpose. Exploratory data analysis, for example, could be used to uncover patterns and relationships in spatial data. A thematic map's theme(s) are made up of a mix of marks, channels, quantitative and/or qualitative data, and sometimes even a base map that serves as a point of reference.
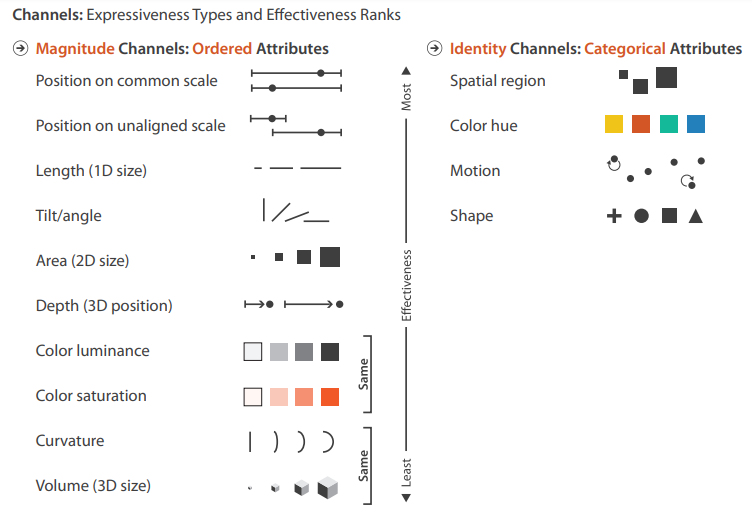
Thematic mapping channel selections are linked to the expressiveness types and effectiveness ranks principles. The expressiveness types principle seeks to match a data type with the appropriate channel. The effectiveness ranks principle simply argues that not all channels are created equal, and that certain channels have a higher importance than others.
Types of thematic maps
Choropleth maps are useful for showing variability in data. A single classification scheme is required and statistical normalization may be necessary. This map type is quantitative, and may be of data type ordinal, interval or ratio. You might want to use choropleth mapping to depict population density, GDP per capita, DUIs per 10,000 persons, etc. Proportional Symbol Maps show that the size of a single dot within a geographic region is based on the absolute magnitude of a quantity. This map type is quantitative, and may be of data type ordinal, interval or ratio.
Graduated Symbol Maps show that the size of a single dot within a geographic region based on the class of a quantity. This map type is quantitative, and may be of data type ordinal, interval or ratio. You might want to use graduated symbol mapping when your desired theme is a choropleth map, but the area attribute is not necessary.
Diagram Symbol Maps are useful for displaying a relationship between variables / attributes. This map type is quantitative and sometimes qualitative, and may be of data type nominal, ordinal, interval or ratio. You might want to use diagram symbol maps for comparing the number of post-secondary graduates by gender in each US State by use of a bar chart.
Dot Density Maps are useful for depicting the geographic distribution of a variable / attribute. Many dots within a geographic region, each portraying quantity. This map type is quantitative, and may be of data type ordinal, interval or ratio. You might want to use dot density maps for depicting the number of people within each US state.
Chorochromatic Maps are useful when there is no data hierarchy. This map type is qualitative, and is of data type categorical / nominal. You may want to use chorochromatic maps for identifying city zoning, water resource regions, and cover types.
Multivariate Maps are a combination of two or more themes.
Exploration of thematic Maps
Now that you've learned how thematic maps are designed, it is time to explore and learn about the types of thematic maps. Here are some suggestions to consider as you explore:
- Can you identify which channels were used to create each of the thematic maps? The Channel Ranking figure could be useful.
- The dot density maps's view is set to World. Notice how the dots begin to indicate a different number of people when you zoom in to a Continent or Country level.
- There is no diagram symbol map below. However, you can find pie charts as one of the hospital shape styles in the Visually encoded map from the previous chapter. Despite the fact that the pie charts in the Visually Encoded Map contain meaningless data, they could, for example, represent each hospital's budget categories.
Test your knowledge
Based on the chorochromatic map, how many health authorities are there in British Columbia?
